Teaches how to draw Circle, Rectangle, Square, Special Polygon, Arc and Ellipse on a Map

Admin 10.03..2020 Category : WEB GIS Education Documents

To create special geometric shapes in the GISLayer Software, the Layer Box should have a vector layer.

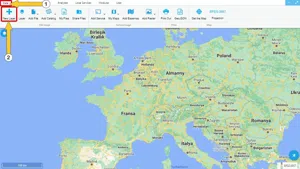
If you don’t have a vector layer Click on Data -> New Layer buttons to open panel and create a new layer using this panel.

The following screenshot shows the position of the Create Vector Layer Panel.

Drawing Special Geometric Shapes On The Map

Step 1: Activating the Vector Layer

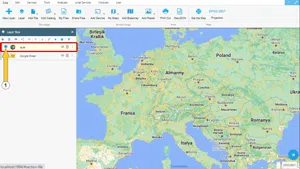
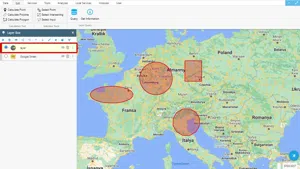
The vector layers that you create within the GISLayer Software or insert into the map using files are also layers that enable you to create and edit. To work on a layer, you must first activate the layer. For this, the radio button next to the layer name should be selected and the layer should be activated.

The following screenshot shows the location of the radio button.

Drawing Special Geometric Shapes On The Map

Step 2: Enable Editing on Vector Layer

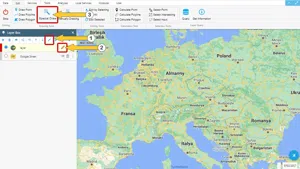
To enable editing of a vector layer in the GISLayer Software, click on the pencil icon in the top button group of the Layer Box panel. A click on the pencil icon will show the pencil icon in the right button group of the corresponding layer. Simultaneously, the Edit menu opens, which also contains drawing tools, and the layer can now be edited.

Special drawings are generally polygon drawings.

The following screenshot shows the active edit mode of the layer due to the numbered steps.

Drawing Special Geometric Shapes On The Map

Step 3: Introducing the Special Drawing Tools in the Edit Panel

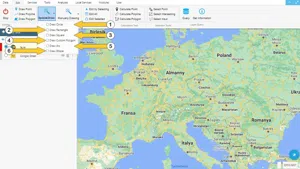
After you have enabled editing in the GISLayer software, the Edit panel will open automatically. Special drawings tool in this panel has 6 main geometry types to create. These can be listed as follows;

  1. Draw Circle
  2. Draw Rectangle
  3. Draw Square
  4. Draw Custom Polygon – (Triangle and polygon with any number of edges)
  5. Draw Arc
  6. Draw Ellipse

In the Draw Custom Polygon tool, the user can enter the number of edges. For example, if you want to draw an octagon, the number of edges is entered as 8.

The following screenshot shows the locations of these tools.

Drawing Special Geometric Shapes On The Map

If the drawing is finished, the user can change the editing mode by clicking Stop button.

Drawing Special Geometric Shapes On The Map

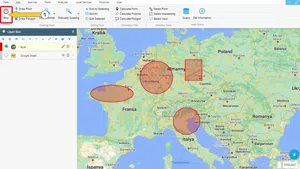
The following screenshot shows examples of Special Geometric Shapes.

Drawing Special Geometric Shapes On The Map

Related Documents

Create a New Vector Layer
Add Vector Layer Files
Layer Box Usage

Layer Box Usage

10.03.2020
Vector Drawing On The Map

Other Documents

Create a New Vector Layer
Add Vector Layer Files
Layer Box Usage

3-Layer Box Usage

10.03.2020
Adding WFS Service
Adding WMS Service
Adding XYZ Tile Service
Adding PBF and MVT Vector Tile Service
Usage Basemaps & Adding to Map
Add Ministry Of Environment & Urbanisation Base Maps
Usage TKGM & HGM Basemaps
Vector Drawing On The Map
Drawing Special Geometric Shapes On The Map
Measuring Length & Area On The Map
Getting Information From Vector Feature On The Map
Selecting Vector Feature On The Map
Finding TKGM Parcels On The Map
Setting the Drawing Order of Layers
Adding Previously Used Layers
Displaying the Vector Layer Attribute Data Table
Selections In Attribute Table
Delete Records In Attribute Table
Showing Features Use By Data Attribute Table
Changing Features Color Use By Data Table
Export Attribute Table
Finding Country, City, District And Neighborhood Geometry
Downloading Open Street Map (OSM) Vector Data From The Map
Map Indexing System
Creating Buffers Around Geometries
Clipping Of Geometries Using Overlapping Geometries
Rotate Geometries Around a Specific Anchor
Moving Geometries From One Position To Another
Simplifying Geometries
Smoothing Geometries
Creating the Triangular Terrain Model Using Point Heights
Creating Point, Triangle, And Square Grids Within an Area
Downloading Maps For Offline Use
Get Points From Geometries and Layers
View GeoJson Format Of a Layer
View GeoTiff

39-View GeoTiff

10.03.2020
Add Data With Overpass API
Listing All Updates, Created & Deleted Features
Adding WFS-T Service
Changing Map Color
Raster Color Information
Saving & Displaying System Files
Listing System Files & Adding To The Map
Sharing System File
Displaying Files & People You Share
Displaying, Adding & Deleting My Shared Files
Adding the Shared File to The Map & Stop Sharing
Add, Edit, Delete Geometry in Real-Time
Sending Back System File Changes
Displaying Log Table
Making a Map Open to Everyone
Listing Maps Shared With Everyone
Drawing Arc

56-Drawing Arc

10.03.2020
Display Available GISMoney
Sign In

58-Sign In

10.03.2020
Adding Raster Files
Remote Sensing Analysis
Getting Printout Map
Spatial Layer Joining
Querying Layer Attributes
Layer Styling

64-Layer Styling

10.03.2020
Creating Analysis Result Chart
Heatmap Density Map Analysis
Thematic Map Analysis
Coordinate Transformation
Creating Isohips Curve
Catalogue Upload
Creating a Catalogue File
System Settings

72-System Settings

10.03.2020
Manual Free Hand Drawing
Google POI Data Collecting
Creating Elevation Profile
Downloading Layers as File
Finding Intersections Between Geometries