In GISLayer Software, changing the colors of the records allows you to focus on them more easily on the map. You can even create a thematic look if you wish. Coloring offers the user 4 different options. These are;
- Color All
- Color Selected
- Color Filtered
- Color to the Original
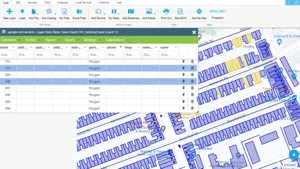
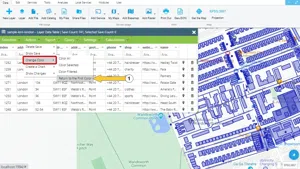
In the screenshot below, coloring options are shown in numerical order.
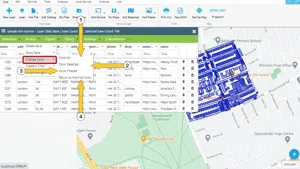
1. Color All
Color All changes the color of all records in the table.
The following screenshot shows the color change of the layer on an example that shows before and after the action.
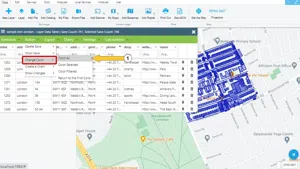
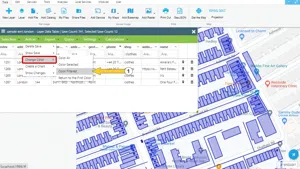
2. Color Selected
Color Selected: Changes the color of all records selected in the table
The following screenshot shows the color change of the layer on an example that shows before and after the action.
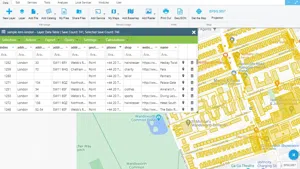
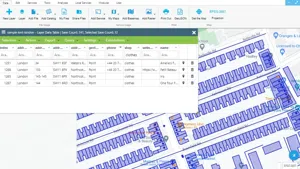
3. Color Filtered
Color Filtered: Changes the color of all records filtered in the table
In the screenshot below, "clothes" filtering has been made and sampled before and after to show the change in layer color.
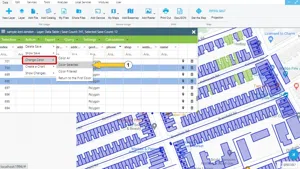
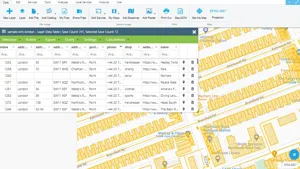
4. Color to the Original
Color to the Original: Restores all records to the original color that the layer originally had.
The screenshot below shows an example. In this example, the changed color is brown, and the originall color is blue.


Related Documents