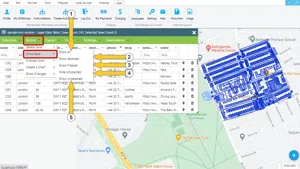
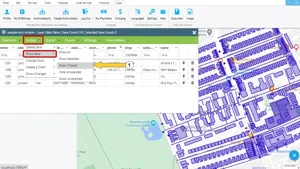
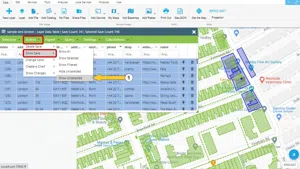
In GISLayer Software, Show Save is used to zoom to the records and display them in a different color for a short time. The goal is to make it easier to see saves that you want to focus on. Saving in the attribute table is done by entering the Action menu in the table and selecting the Show Save option. There are 5 different show record options. These are;
- Show All
- Show Selected
- Show Filtered
- Hide Unselected
- Show Unselected
The following screenshot shows the locations of these options.
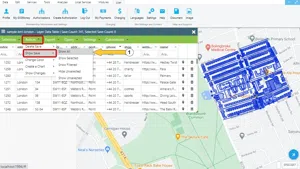
1. Show All
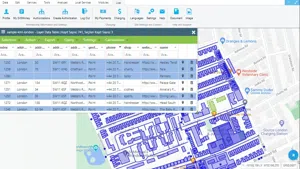
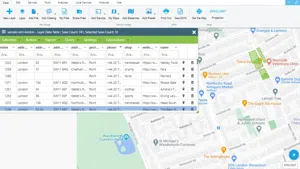
Show All is used to view all records on the map by zooming and changing their color for a short time.
The following screenshot shows an example that includes the before and after the action.
2. Show Selected
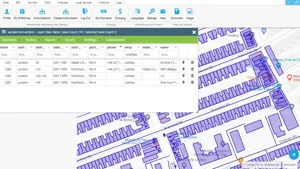
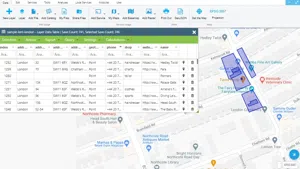
Show Selectedshows all the selected records in the table by zooming to the vector data on the map.
The following screenshot shows an example that includes the before and after the action.
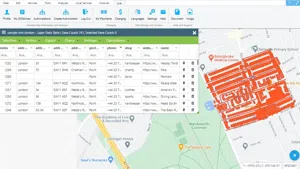
3. Show Filtered
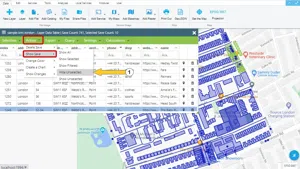
Show Filtered is used to view filtered records on the map by zooming and changing their color for a short time.
In the following images, "clothes" filtering is shown on an applied example as before and after.
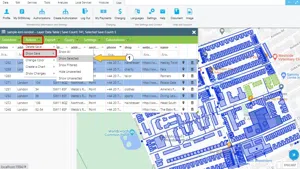
4. Hide Unselected
The Hide Unselected option is used to show geometries selected in the list, while hiding unselected ones. It is a feature whose purpose is to concentrate only on selected geometries in very crowded maps.
It is illustrated and shown in the image below.
5. Show Unselected
The Show Unselected option is used to show geometries that have been left out of the selection in the list and hide the selected ones. It is a feature whose purpose is to concentrate only on selected geometries in very crowded maps.
It is illustrated and shown in the image below.


Related Documents