In the GISLayer Software, the “Layer Box” can be accessed in 3 different ways. These are;
- By clicking on the “Layers” button in the “Data” tab
- By clicking the layer button in the top left corner of the map screen
- By clicking the layer button in the button group located in the lower right corner of the screen and listed in the third row from the top
In the following screenshot you will find buttons and their positions with which you can open the “Layer Box”. In the “Layer Box”, there are ten buttons on the top row and layers added to the map.
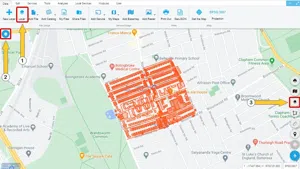
1 – Using Buttons in “Layer Box”
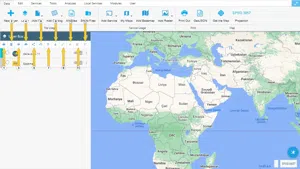
In the GISLayer software, there are 12 buttons at the top row of the “Layer Box”. These are;
- Create New Layer: Opens “Create New Layer Dialog Box”
- Delete All Layers: Removes all layers in the layer box from the map
- Toggle Visibility Of All Layers: Allows you to change the visibility of the layers.
- Displaying System Files: Displays the layers saved in the system
- Show Sharing: Displays the files you've shared, files shared with you, and usermap shares
- Move Up: Used to make the layer appear above the previous one relative to Zindex level
- Move Down: Used to make the layer appear below a next one relative to Zindex level
- Geometry Drawing and Editing Lock: Unlock vector layer editing and enable drawing capabilities on these layers
- Previously Used Layers: Used to quickly add layers to the map by storing previously used layers
- Style Layer Appearance: Opens “Layer Appereance Styling Dialog Box”
- Create analysis chart: Opens the dialog box that allows the preparation of analyzes such as pie, line and bar graph using the information contained in the vector layers.
- Filtering in Layer: Opens the dialog box used to query and filter within the active layer
2 – Using Layer List
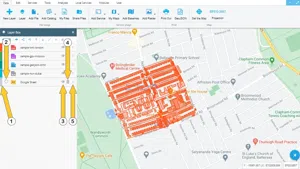
The GISLayer software contains layers after the buttons in the upper row of the “Layer Box”. Let us itemize the use of the layers listed here;
- Quick Color Change: Used if we want to change the color of layers quickly and practically
- Radio Button: Used to activate layers
- Visibility Close: Used to toggle the visibility of layers on the map
- Remove from Layer List and Map: Used to remove layers from the map
- Other Features: It is a special menu for the layer and it differs according to the type of layer. Used for more complex tasks.
The following screenshots show the positions of the buttons.
3-Layer Special Menu
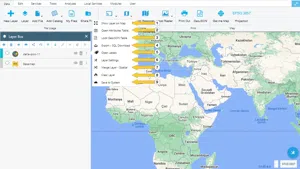
There are 9 buttons in the menu that opens by clicking on the “Other Functions” button, which is located at the end of the each layer name in “Layer Box” in the GISLayer software. These are;
- View Layer on Map: Used to extend the layer so that it fits into the map window
- Open Attribute Table: Opens the attribute table of the layer
- See GeoJSON Output: Displays the geojson output of the layer
- Export – Download SQL: Used to download the layer to the computer in the file formats available to the users
- Open Tags: Used to set a field of the layer’s attributes as a label and display it on the map
- Layer Settings: Allows you to make changes within the layer.
- Merge Layer-Spatial: Used to create a new layer or to merge two different layers by spatial relations of their geometries
- Empty the Layer: It does not delete the layer, but used to erase existing geometries within the layer.
- Save to System Allows you to save the layer to the system
The following screenshot shows the positions of the buttons.


Related Documents