Describes how the density map is created on GISLayer software

Admin 10.03.2020 Category : WEB GIS Education Documents

Density mapping is a data visualization technique that shows the magnitude of a phenomenon in two-dimensional colour. The variation in colour can be hue or intensity, giving the reader clear visual clues as to how the data is clustered. You can create density map in GISLayer software. Click on the 'Density' button in the 'Analyses' menu to create a density map.

Heatmap Density Map Analysis

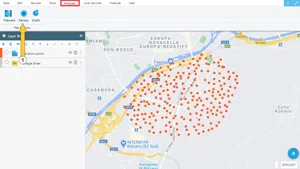
1. Creating a Density Map

Heatmap Density Map Analysis

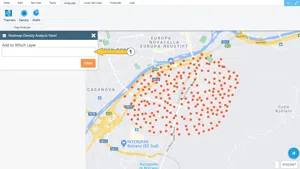
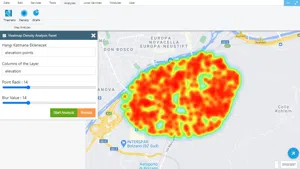
The layer on which density analysis will be made is selected in the opened panel.

Heatmap Density Map Analysis

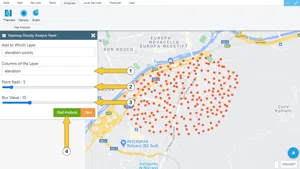
Then, on which column the analysis will be made, the radii of the created points and the turbidity values are entered. The "Start Analysis" button is clicked to create the analysis.

Heatmap Density Map Analysis

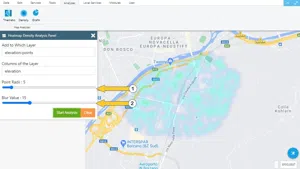
The desired appearance can be obtained easily by changing the point radius and blur values. There is a sample given below.

Heatmap Density Map Analysis

Related Documents

Other Documents

Create a New Vector Layer
Add Vector Layer Files
Layer Box Usage

3-Layer Box Usage

10.03.2020
Adding WFS Service
Adding WMS Service
Adding XYZ Tile Service
Adding PBF and MVT Vector Tile Service
Usage Basemaps & Adding to Map
Add Ministry Of Environment & Urbanisation Base Maps
Usage TKGM & HGM Basemaps
Vector Drawing On The Map
Drawing Special Geometric Shapes On The Map
Measuring Length & Area On The Map
Getting Information From Vector Feature On The Map
Selecting Vector Feature On The Map
Finding TKGM Parcels On The Map
Setting the Drawing Order of Layers
Adding Previously Used Layers
Displaying the Vector Layer Attribute Data Table
Selections In Attribute Table
Delete Records In Attribute Table
Showing Features Use By Data Attribute Table
Changing Features Color Use By Data Table
Export Attribute Table
Finding Country, City, District And Neighborhood Geometry
Downloading Open Street Map (OSM) Vector Data From The Map
Map Indexing System
Creating Buffers Around Geometries
Clipping Of Geometries Using Overlapping Geometries
Rotate Geometries Around a Specific Anchor
Moving Geometries From One Position To Another
Simplifying Geometries
Smoothing Geometries
Creating the Triangular Terrain Model Using Point Heights
Creating Point, Triangle, And Square Grids Within an Area
Downloading Maps For Offline Use
Get Points From Geometries and Layers
View GeoJson Format Of a Layer
View GeoTiff

39-View GeoTiff

10.03.2020
Add Data With Overpass API
Listing All Updates, Created & Deleted Features
Adding WFS-T Service
Changing Map Color
Raster Color Information
Saving & Displaying System Files
Listing System Files & Adding To The Map
Sharing System File
Displaying Files & People You Share
Displaying, Adding & Deleting My Shared Files
Adding the Shared File to The Map & Stop Sharing
Add, Edit, Delete Geometry in Real-Time
Sending Back System File Changes
Displaying Log Table
Making a Map Open to Everyone
Listing Maps Shared With Everyone
Drawing Arc

56-Drawing Arc

10.03.2020
Display Available GISMoney
Sign In

58-Sign In

10.03.2020
Adding Raster Files
Remote Sensing Analysis
Getting Printout Map
Spatial Layer Joining
Querying Layer Attributes
Layer Styling

64-Layer Styling

10.03.2020
Creating Analysis Result Chart
Heatmap Density Map Analysis
Thematic Map Analysis
Coordinate Transformation
Creating Isohips Curve
Catalogue Upload
Creating a Catalogue File
System Settings

72-System Settings

10.03.2020
Manual Free Hand Drawing
Google POI Data Collecting
Creating Elevation Profile
Downloading Layers as File
Finding Intersections Between Geometries