Attribute table; the attribute table is used to display common fields of the geometries of a vector layer as table. This feature we have created for you has a stronger processing capacity, unlike many other GIS programs.
To display the attribute table of the vector layer in GISLayer software;
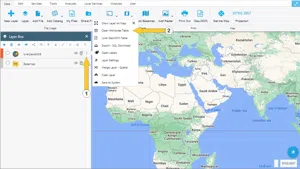
You can list the data of all geometries in the layer by clicking the Other Features button, which is located as three points on the far right of the layer whose data you want to list in the Layer Box, and clicking Open Attribute Table in the drop-down list.
The buttons and their sequence of use are shown in the following screenshot.
Part 1: Introducing the Attribute Table
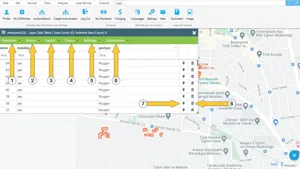
The attribute table that opens shows the common properties of the geometries in your vector layer. The opened attribute table can be expanded and contracted in aspect ratio with the green triangle in the lower right corner. The table shows the user the data in the order in which the geometries are inserted.
You can easily perform filterings with quick filter option, which are located under the column names in the table. There are also 6 main menus at the top of the Layer Attribute Table. Additionally, two buttons for each geometry, located at the end of the rows, are described with the numbers 7 and 8. These are;
- Selection
- Operation
- Export
- Query
- Settings
- Calculations
- Zoom to Feature
- Delete
These menu locations and buttons are shown in the screenshot below.
1. Selection Menu and Sub-Options
Separate selections are made by holding down the CTRL key and clicking with the mouse in the first column of the layer attriubute table, which shows the sequence number of the geometry (CTRL + mouse-left-click). Likewise, the selection is cancelled when the sequence number of the selected geometry is clicked.
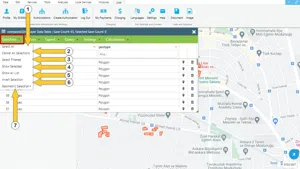
If you click on the Selection menu shown above, you will be presented with 6 different options. These are;
- Select All: Selects all records in the table.
- Clear All Selections: Cancels all existing selections.
- Select Filtered: When filtering is complete, the records in the filter result are selected.
- Show Selected: Lists only those selected, non-selected will be unvisible in the table.
- Show All: Shows all save list
- Switch Selection: Clears selected and selects unselected geometies in the table.
- Spatial Selection: Activates the spatial selection within the layer whose attributes are listed, as shown earlier in the Edit menu,
- Select by Clicking on Map
- Select Intersections: Select geometries that intersect with a drawn Line
- Select Within: Select all geometries within the drawn Polygon
- Close Selection Actions: Closes the action panel
The locations of these tools are shown in the screenshot below.
2. Operation Menu and Sub-Options
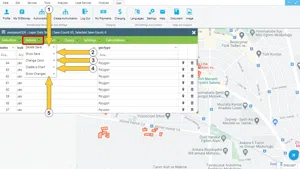
There are 4 different options in the Operation Menu. These are;
- Delete Record
- Show Record
- Change Color
- Create Chart
- Show Change
1-Delete Record: It is used to delete the vector data using table. And It has 3 sub options. These are;
- Delete All Records: Deletes all the records in the table
- Delete Selected: Deletes all selected records in the table
- Delete Filtered: Deletes all filtered records in the table
2-Show Record: It is used to zoom to the records and display them in a different color for a short time. The goal is to make it easier to see records that you want to focus on.
- Show All: Shows all the records in the table
- Show Selected: Shows all selected records in the table
- Show Filtered: Shows all filtered records in the table
- Hide Unselected: Hides unselected geometries
- Show Unselected: Shows unselected geometries
3-Change Color: Changing the colors of the records allows you to focus on them more easily on the map. You can even create a thematic look if you wish.
- Color All: Changes the color of all records in the table
- Color Selected: Changes the color of all selected records in the table
- Color Filtered: Changes the color of all filtered records in the table
- Color to the originall: Restores all records to the original color that the layer originally had.
4-Graph All: It is used to create graphs for analysis. For example, you can create pie chart, bar chart, line chart, and export these charts. For this purpose;
- Graph All: You can graph all the records in the table.
- Graph Selected: You can graph all the selected records in the table.
- Graph Filtered: You can graph all the filtered records in the table.
- Show Change: Shows the changes made on vector data.
- List New Added: Lists newly added saves
- List Edited: Shows edited geometries
- List Deleted: Shows deleted saves
- List Available: Shows available saves
These options are shown in the screenshot below.
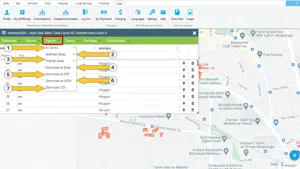
3. Export Menu and Sub-Options
While the first three options in the Export Menu export your geometric data, the remaining 4 options help you to export the data in the table. These are;
- All Records: It is used to export all records in SHP, KML, GeoJSON, WKT, GPX, NCN, Geo Excel formats and EPSG: 4326 Projection system
- **Selected Records:**It is used to export all selected records of the table in SHP, KML, GeoJSON, WKT, GPX, NCN, Geo Excel formats and EPSG: 4326 projection system.
- Filtered Records: It is used to export all filtered records in SHP, KML, GeoJSON, WKT, GPX, NCN, Geo Excel formats and EPSG: 4326 Projection system.
- Download as Excel: You can download all records in the table as EXCEL
- Download as PDF: You can download all records in the table as PDF
- Download as JSON: You can download all records in the table as JSON
- Download as CSV: You can download all records in the table as CSV
Shown in the screenshot below.
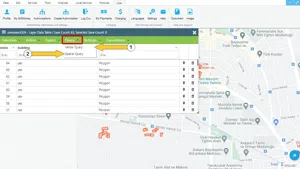
4. Query Menu
Two types of queries can be performed in the query menu. These are;
- Attribute Query: Query based on existing information of geometries in table
- Spatial Query: Query based on the spatial relation of geometric data with each other.
Shown in the screenshot below.
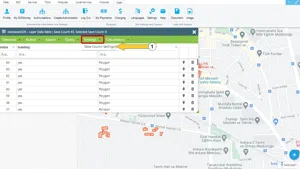
5. Settings Menu
An option opens in the settings menu. This;
- Table Column Settings: Lets you edit the columns in the table
It is also shown in the image below.
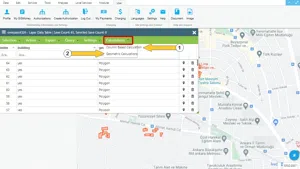
6.Calculation Menu
There are 2 options in the Calculations Menu. These are;
- Column Based Calculations: It allows transactions between the common columns of the listed records, numerical and alfanumerical calculations can be performed according to the data type of the columns. It enables transactions between columns.
- Geometric Calculations: It allows to make vector calculations by using the geometric information of the listed data. There are also different operations than field calculation, finding lengths.
It is shown in the image below.


Related Documents